| |
 more... more... |
| |
|
Chartbot™
How It Works
|
 |
|
|
Chartbot works
in a unique manner: it is an EPS file built with Soft Horizons'
ActiveEPS™ technology. Text data overprinted on the EPS
graphic is automatically converted into a chart. |
|
|
| |
| |
|
| Here's how to create
a chart. |
|
| |
| |
|
|
|
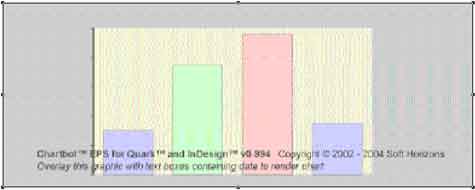
Start by doing
a "Place" of Chartbot's Bar chart EPS. The image
you see isn't a preview—it's just a low-res "stand-in"
for positioning. |
 |
|
| |
| |
|
|
|
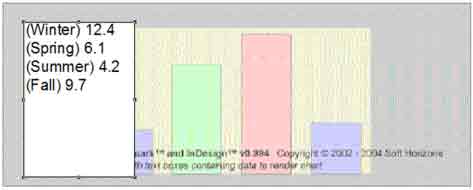 |
Enter
label and data on
top of Chartbot's EPS. The data will
not print, but instead will feed data to the chart. |
|
| |
| |
|
|
|
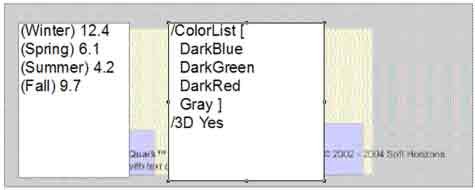
Add in formatting
instructions. Most users use InDesign's template
feature once
they have a design. This
example is very basic — the design possbilities are
infinite. |
 |
|
| |
| |
|
|
|
 |
Preview the results by "Printing" to a PDF or PostScript printer.
You can change the data, or change the formatting.
The chart will be automatically updated each time you
Print.
|
|
| |
| |
|
|
|
It's
easy to change chart types: just 'Place' the
appropriate ActiveEPS chart. This is the same data as above
with the same formatting, applied to a Chartbot pie chart. |
 |
|
| |
|
| |
more... |
| |
|
| |
|